Climate Risk Index for the Australian energy sector

20.02.2024 - 03:14
Mandala Partners (Mandala) in conjunction with Zurich Financial Services Australia (Zurich) has produced Australia’s first Climate Risk Index for the national energy generation sector. This report highlights the growing risk of climate change to the grid, how that risk is spread across the grid, and high-level options for mitigating those risks. More than 25% of Australia’s power generation assets are in the three highest categories for climate change risk.
"Australia’s energy generation assets underpin almost every aspect of economic and social interaction in the 21st century, however, much of the focus to date has centered on the risk of the energy grid to climate change, rather than on the risk of climate change to the grid."
- Justin Delaney, Chief Executive Officer, Zurich Australia & New Zealand
The Australian energy grid is critical to industry, consumers and the green transition
The last decade of energy policy has focused on transitioning to renewable energy sources and reducing prices for consumers. While prices have steadily climbed during this period, policies to transition the Australian grid have been fruitful.
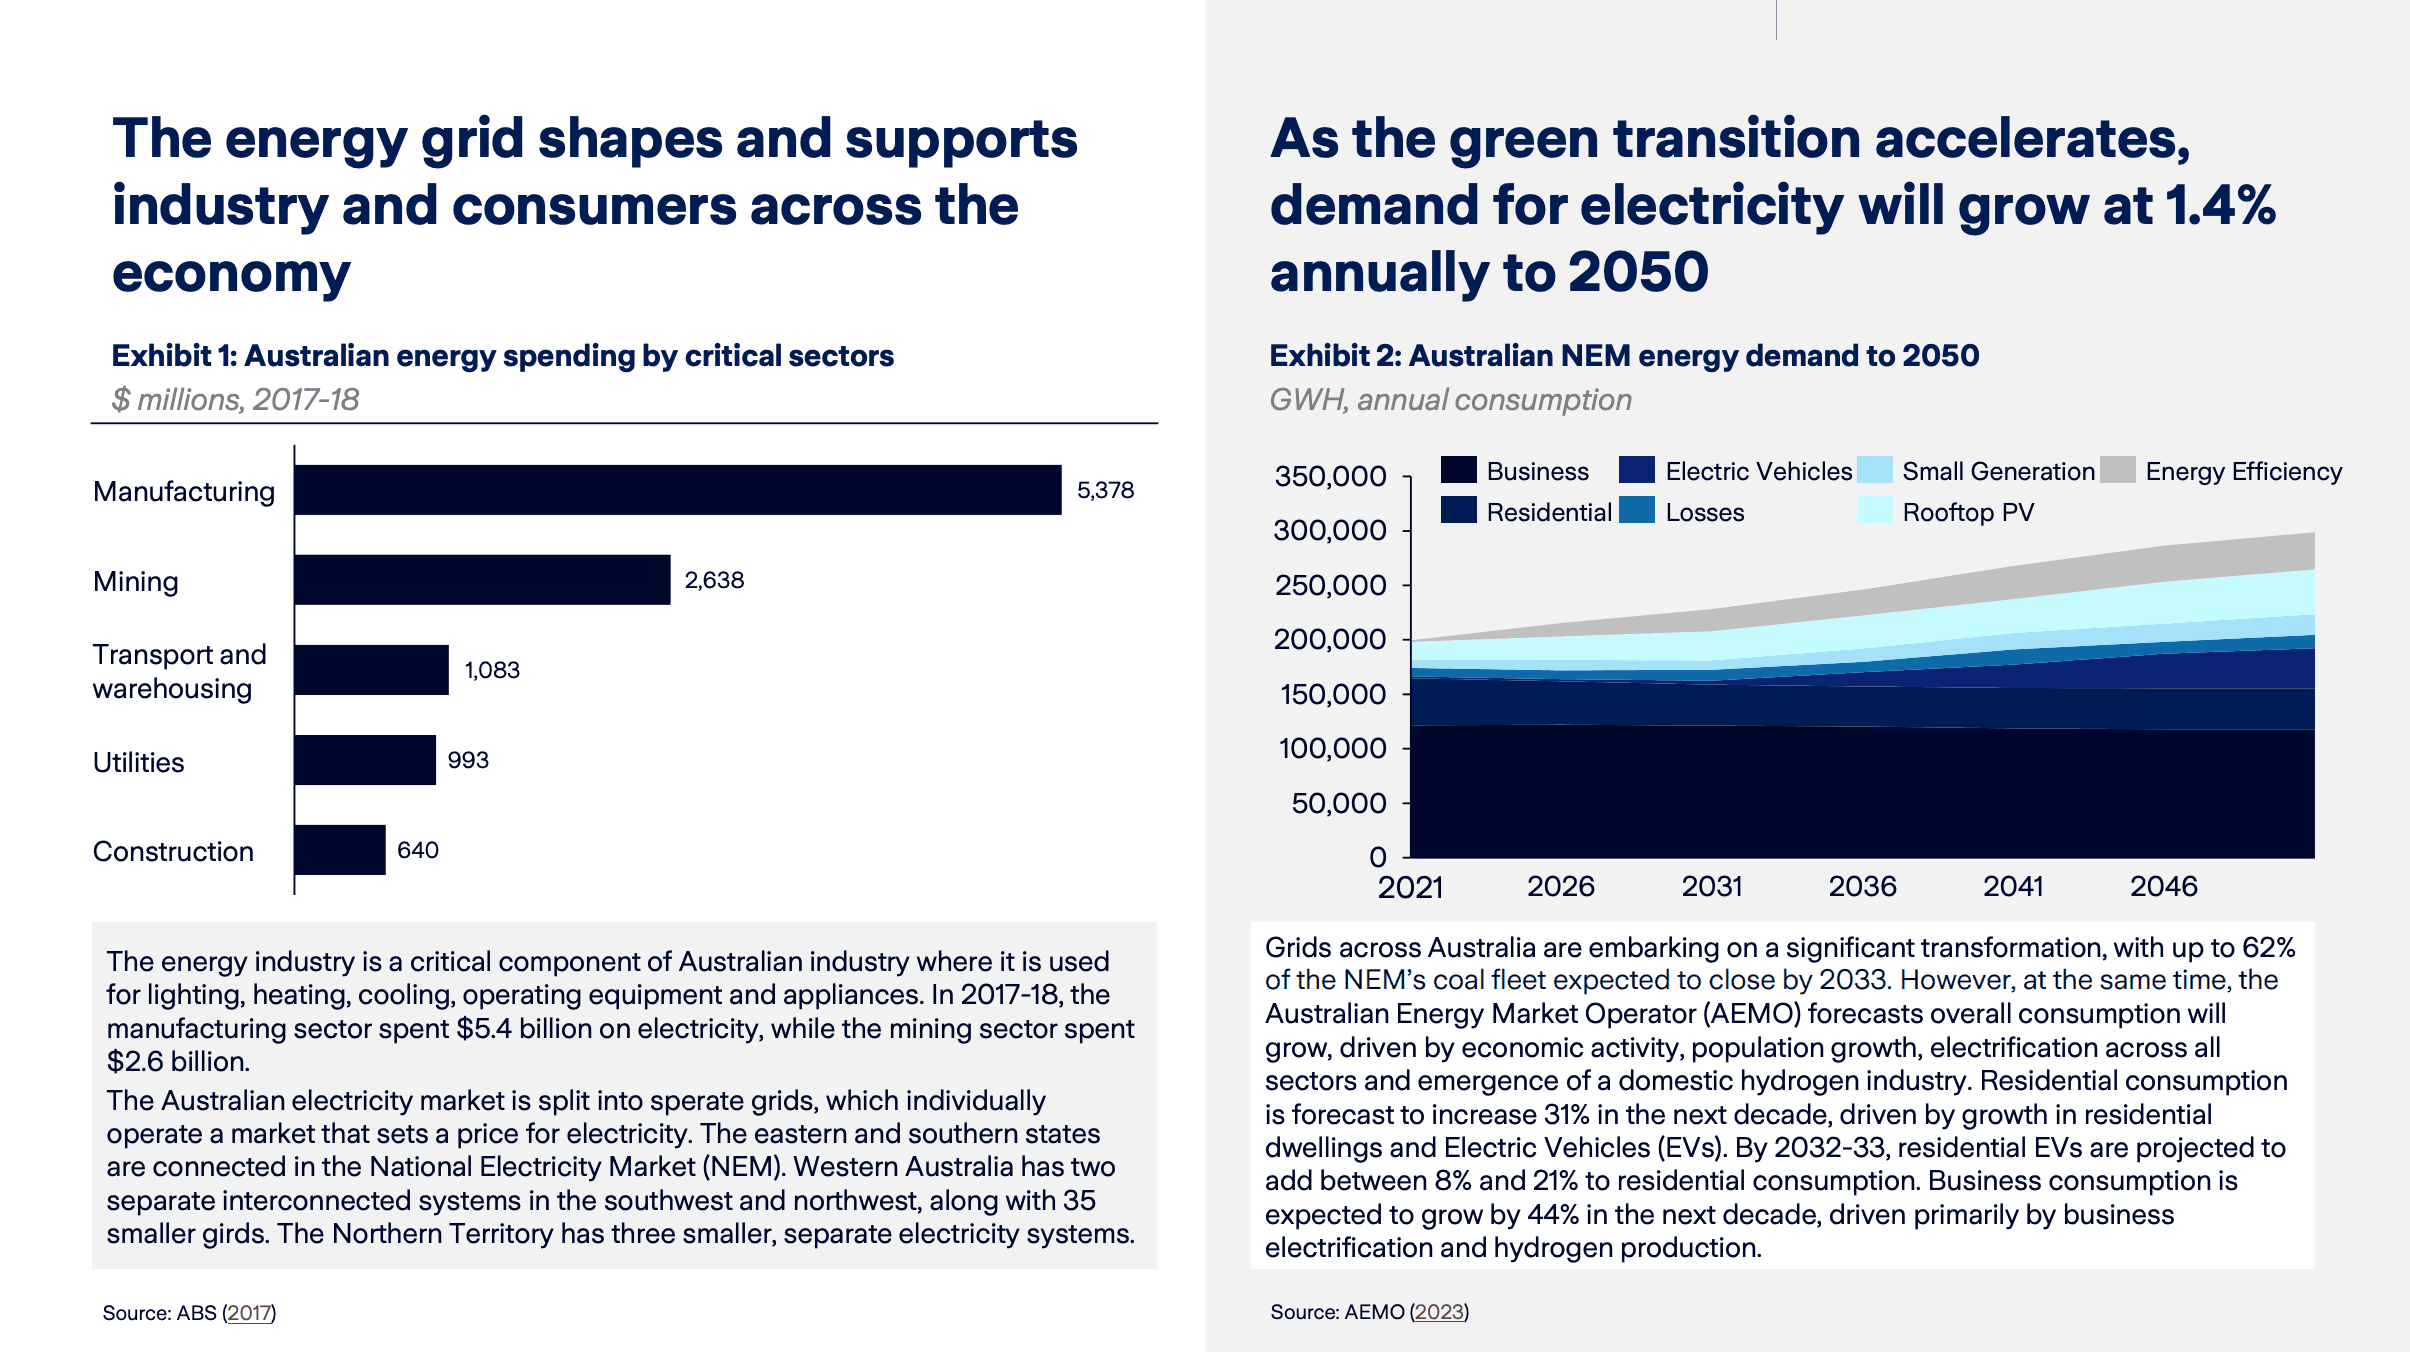
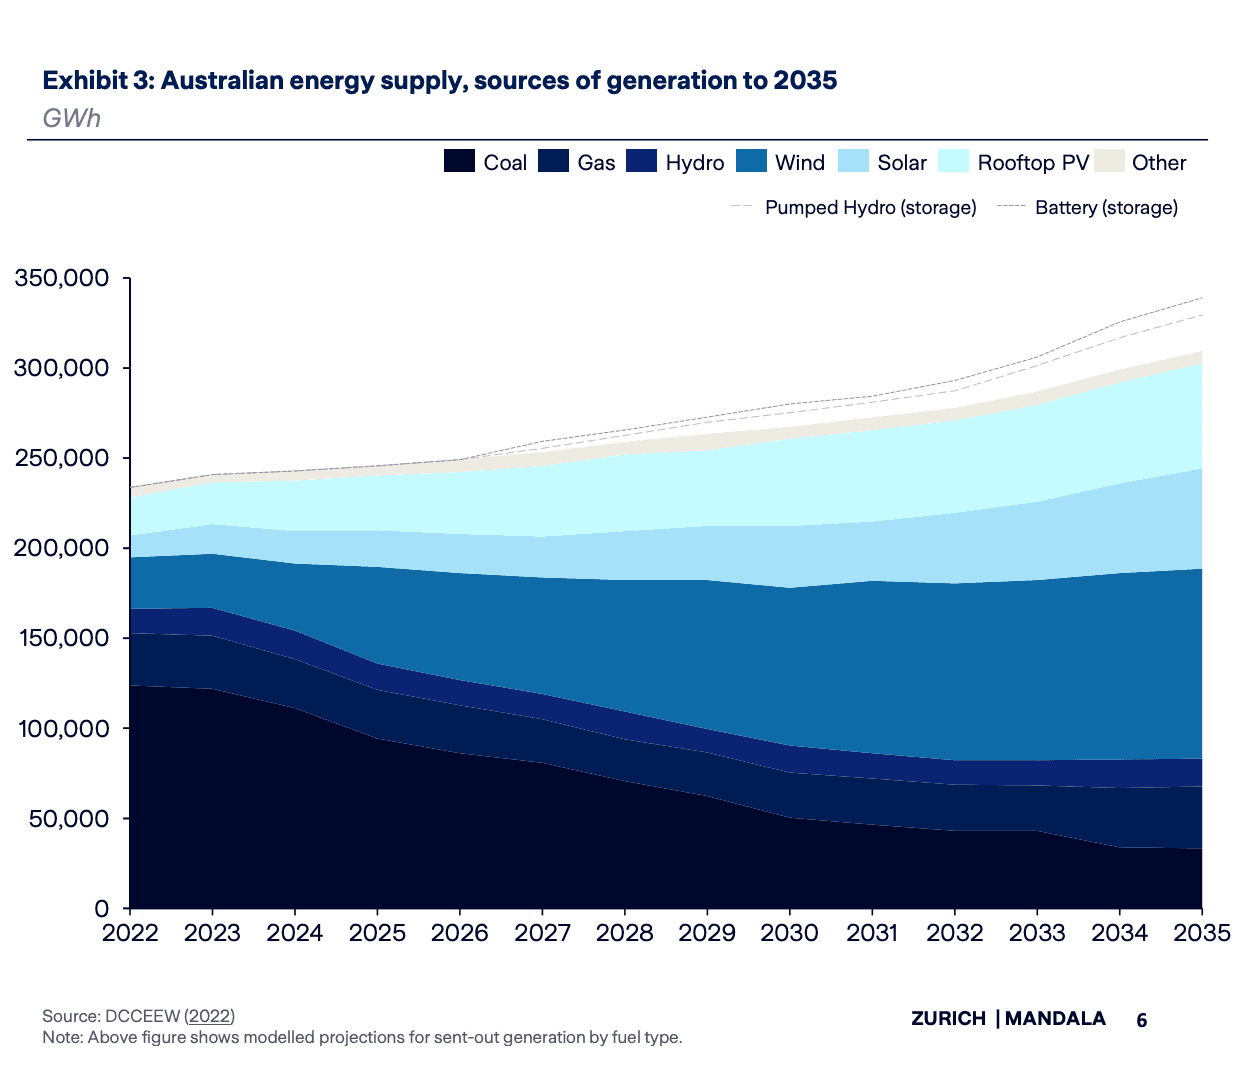
During this period, the capacity of electricity generation from renewable sources has increased 215% from 26,700 GWh of generation in 2011-12 to 84,000 GWh in 2021-22. Under the Renewable Energy Target, this transition is required to accelerate with the goal to boost renewables to 82% of the grid by 2030.
This transition has been supported by the Australian Government’s green bank, the Clean Energy Finance Corporation (CEFC), which has invested more than $12.7 billion in large-scale renewable and transmission-related projects during the last 10 years.
The Australian Government’s October 2022-23 budget included $20 billion for its ‘Rewire the Nation’ program, a National Reconstruction Fund of $15 billion and the Powering the Regions Fund of $1.9 billion. Likewise, state governments have made numerous significant investments in energy infrastructure including renewable projects, transmission upgrades, storage capabilities and jobs plans.
Climate affects the stability and efficiency of the grid, leaving Australia vulnerable to growing climate risk
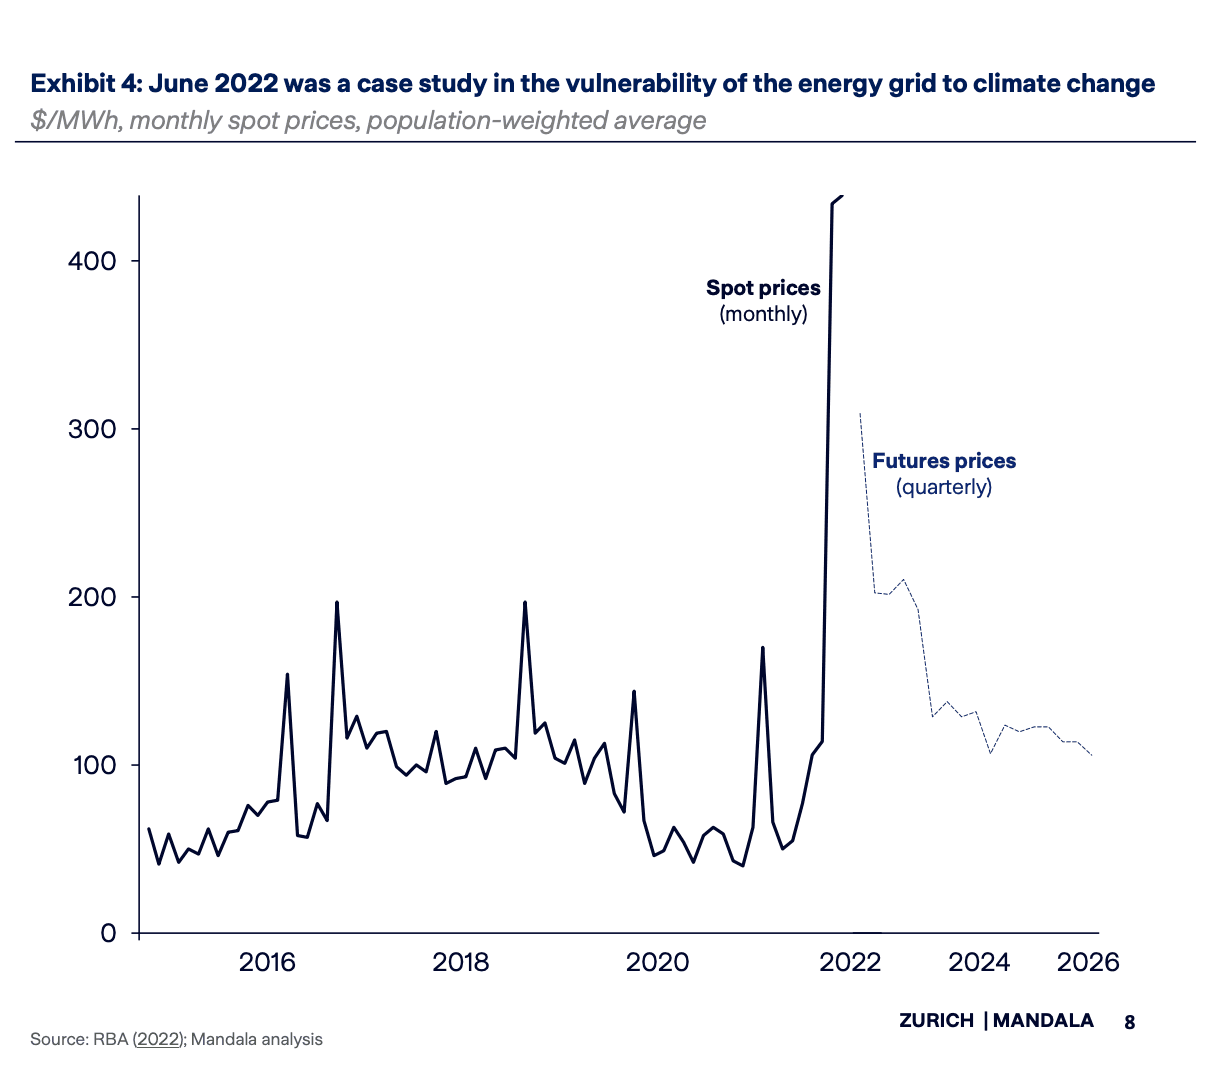
In June 2022, the monthly average spot price for electricity hit above $350/MWh. In response, the Australian Energy Market Operator (AEMO) suspended the entire National Electricity Market (NEM), declaring the spot market had become “impossible to operate”.
June 2022 was a case study in the vulnerability of the energy grid, showing how a system already disrupted by global factors can be tipped into chaos due to climate-related factors.
Driven by Russia’s invasion of Ukraine, demand and prices for thermal coal sharply increased. Other coal generators faced further disruption due to staff shortages and the impacts of La Niña on coal production. Lower-than expected power generation from renewables also contributed to the overall price increase as adverse weather reduced the efficiency of solar generation. Meanwhile, total demand from the NEM was higher than in previous years. Exceptional rainfall and a series of cold fronts had impacted Queensland and Victoria and led to relatively high total demand from the period.
As these factors drove up prices, the AEMO implemented a price cap for a few days. This led to generators withdrawing from the market and caused the AEMO to suspend the NEM.
Zurich Resilience Solutions (ZRS) provides insights and solutions to help organisations proactively manage and build resilience to traditional and evolving risks, such as climate change and cyber
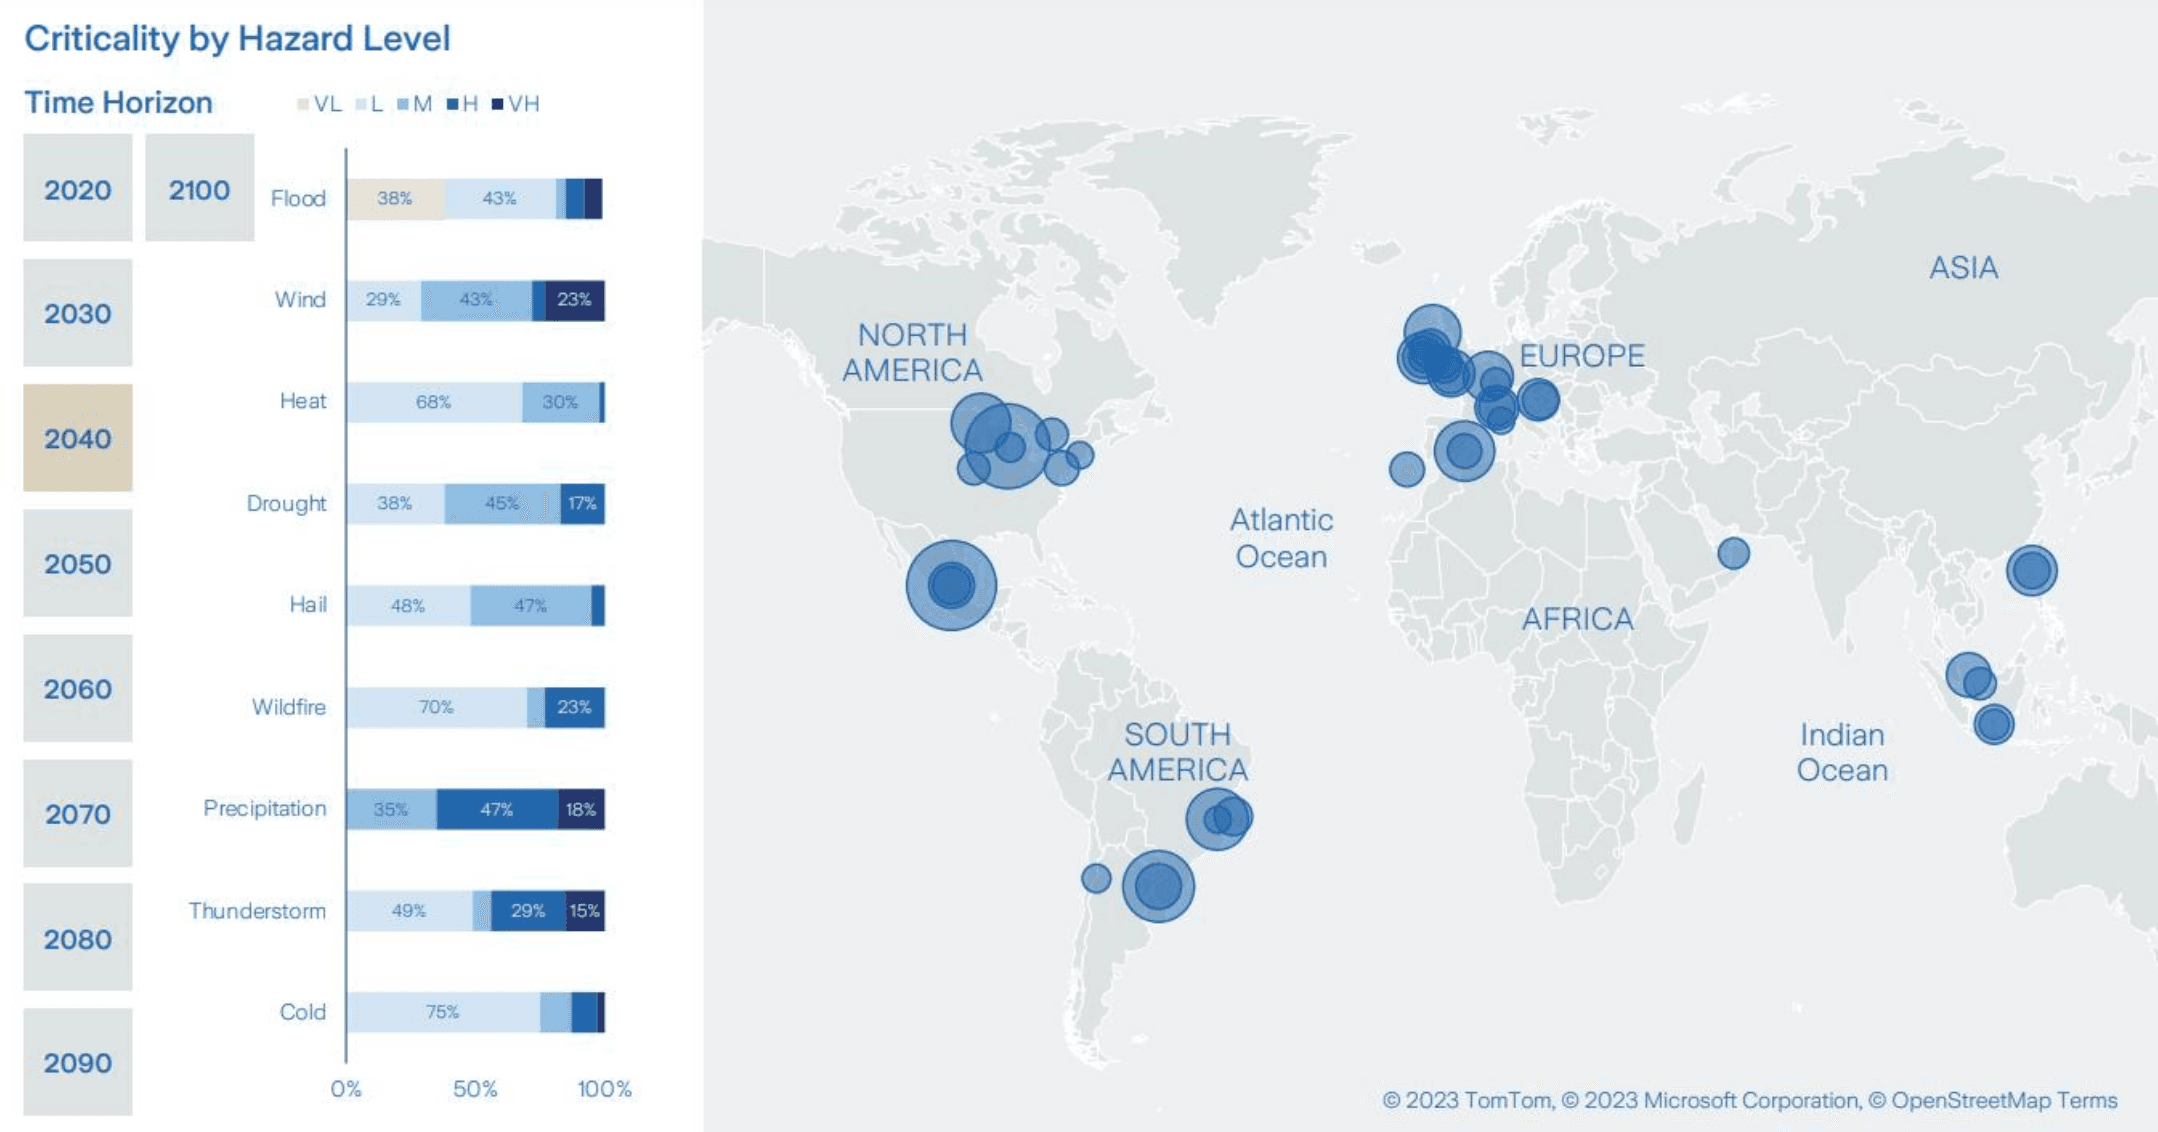
ZRS global exposure analysis transforms location or asset data into deep climate risk insights. Through a customised and interactive dashboard, businesses and asset owners can understand the probability that climate risks – such as heat, flood and fire – may impact a specific asset or portfolio of locations over different time horizons using three IPCC-based climate scenarios. These insights quantify and contextualise climate exposure to ensure risk can be understood, tracked and shared in order to appropriately prioritise actions and investments.
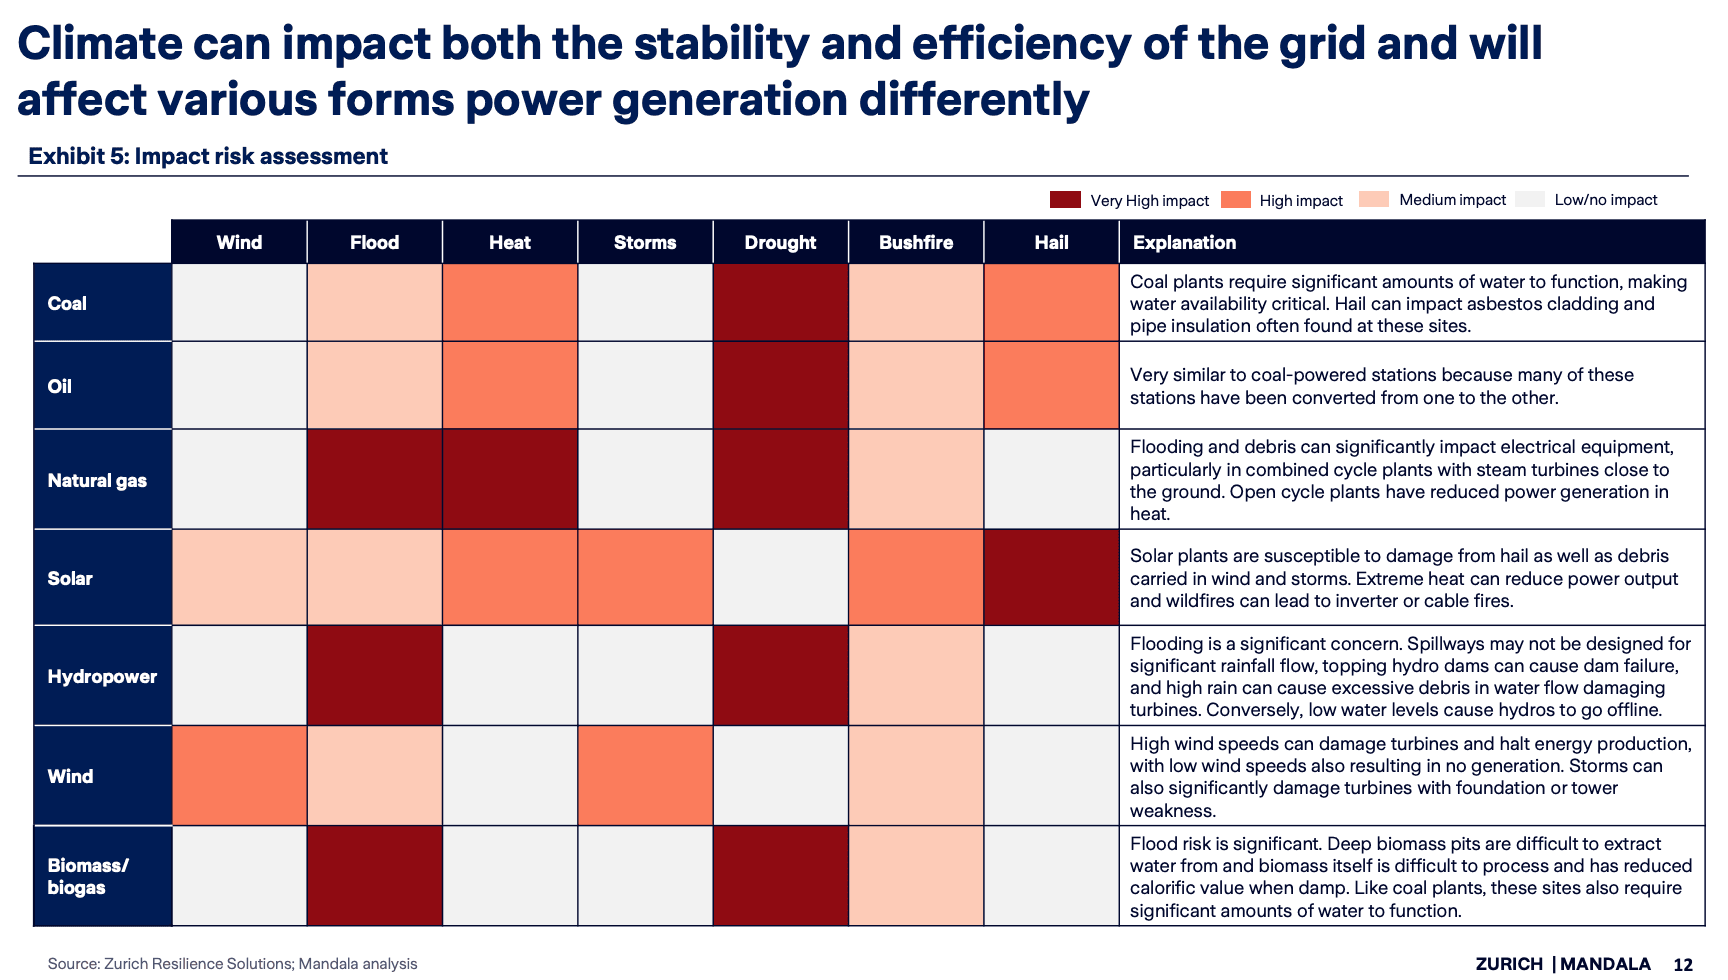
Solar generation is currently most consistently at risk, while coal and biomass are least at risk across Australia
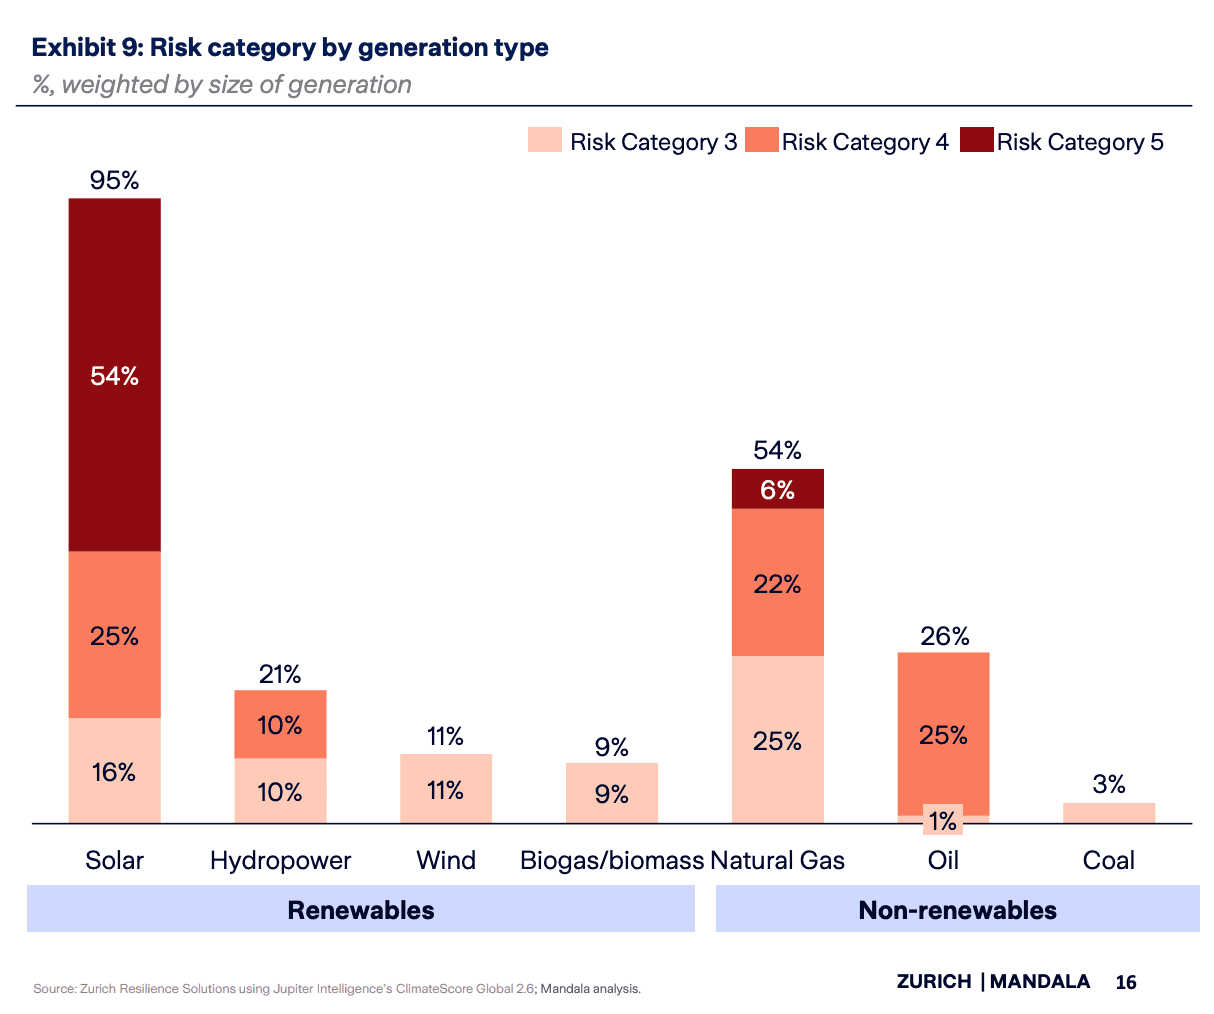
The risk posed by climate perils varies significantly by generation type. Based on the location of current generation sites, solar and natural gas face the highest risk.
The Zurich-Mandala Index found that 95% of solar generation sites were in the three highest risk categories, with 54% in the highest category. This reflects the relative vulnerability of solar panels to numerous perils. Note that this analysis does not include rooftop solar as no granular data is available on its locations. This means that overall risk for solar generation may be more diversified.
The second most at-risk generation types were natural gas and oil, which were found to have 54% and 26% of their generation respectively in risk category 3 and above. This result has been driven by the susceptibility of these generation types to perils such as high temperatures and drought.
Other forms of renewable energy like wind and biogas/biomass sat alongside coal with relatively low risk. A minimal number of these sites were in the highest three categories and less than 1% of generation were in risk categories 4 and 5.
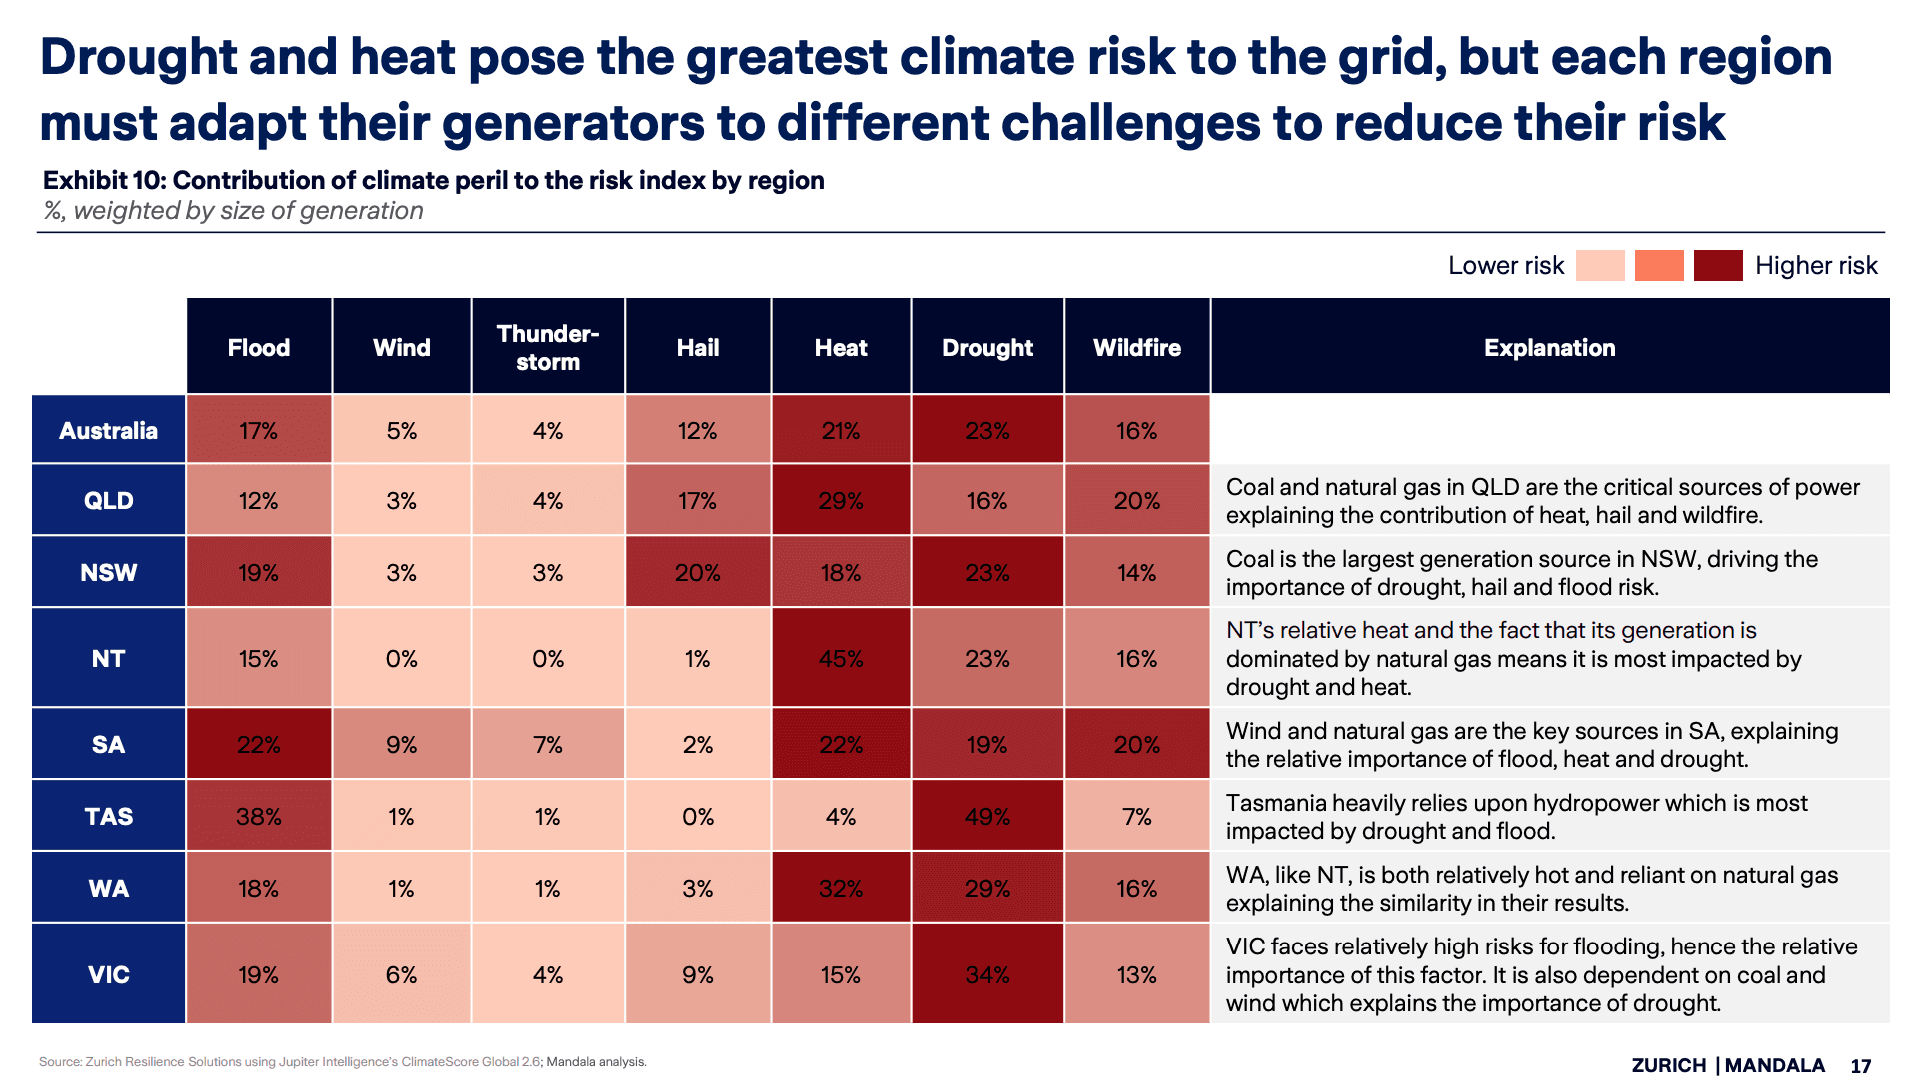
More work must be done to ensure the grid is adapted to the reality of climate change
The impacts of extreme weather events caused by climate change put the stability and efficiency of Australia’s energy industry at risk. Extreme weather can impact all points of the energy production and consumption process – including fuel extraction, processing, transportation, generation, transmission and storage, and customer demand. As shown by this report, site selection and planning is critical to ensure new infrastructure is resilient given variability in peril type and severity is significantly impacted by geography. Beyond this, structural and management adaptation measures are also important for building resilience, particularly for existing sites.
This analysis, conducted in conjunction with Mandala Partners, hopefully represents a useful input into achieving an appropriate and resilient energy transition.
Read our latest posts

Rethinking the APR
Mandala's latest research, commissioned by Block, examines whether US credit disclosure requirements remain fit for purpose in a rapidly evolving lending market. Drawing on economic analysis, a survey of nearly 1,600 US consumers and small business decision-makers, and proprietary credit data, the report finds that Annual Percentage Rate (APR) disclosures can misrepresent the perceived cost of short-term borrowing and influence consumer choices. The report makes the case for modernising credit disclosure requirements, with a more flexible approach that better reflects different credit products while preserving consumer protection and access to credit.
15 Oct, 2026

The augmented attacker: the growing AI-driven cyber threat to Australian businesses
Mandala's latest research, commissioned by CyberCX (part of Accenture), shows that the AI-driven cyber threat to Australian businesses is growing. The report finds that AI could increase the frequency and severity of cyber incidents targeting Australian businesses. As AI-driven threats grow, Australian businesses could face losses reaching up to $37 billion a year. However, investing in foundational cyber defences such as patching known vulnerabilities could reduce annual losses from $37 billion to $13 billion, a $24 billion saving. Three-quarters of the savings are from preventative actions. The report highlights the actions required from businesses and government to improve cyber defence.
13 Oct, 2026

The Stagnant Nation: Lifting Australia’s Dynamism
Australians are going backwards on real wages and income. Real wage growth has fallen from 0.6 per cent in the 2000s to -0.7 per cent today, the slowest rate since the 1990s recession. Weak productivity growth is a key driver. Productivity growth has dropped from 2.2 per cent in the 1990s to just 0.1 per cent today. The Productivity Commission has pointed to declining economic dynamism as one cause for weak growth, with fewer businesses starting, growing and competing. We confirm declining economic dynamism across five key dimensions and estimate that reversing this decline seen since the mid-2000s could see a GDP uplift of $101 billion per year over the next decade. Our analysis finds that regulation could account for around 20 per cent of declining dynamism. Reducing regulatory burden to late-2000s levels could see GDP uplift of at least $20 billion per year over the next ten years.
7 Oct, 2026

Demonstrating the economic benefits of Airwallex in Australia
Mandala's latest research, commissioned by Airwallex, quantifies the direct and indirect economic benefits of Airwallex in Australia. Airwallex supported $4.6 billion in economic benefits in 2025, a figure roughly equivalent to 2 per cent of the Australian tech sector's contribution to GDP. Of this, $2.5 billion flows directly to platform businesses through productivity gains, new market access and cost savings, with the remainder reaching the broader economy as those benefits move through customers' supply chains. Airwallex supports 29,000 jobs across the Australian economy, and a quarter of economic benefits flow to regional, rural and remote areas. Small and medium businesses capture the largest share of any business segment on the platform, $2.1 billion annually, or $200,000 in economic benefits for the average SMB each year.
16 Sep, 2026